Home Forums Chart Support Hide datapoints programmatically

Hide datapoints programmatically

Viewing 5 posts - 1 through 5 (of 5 total)
  • #21909

    Hi,
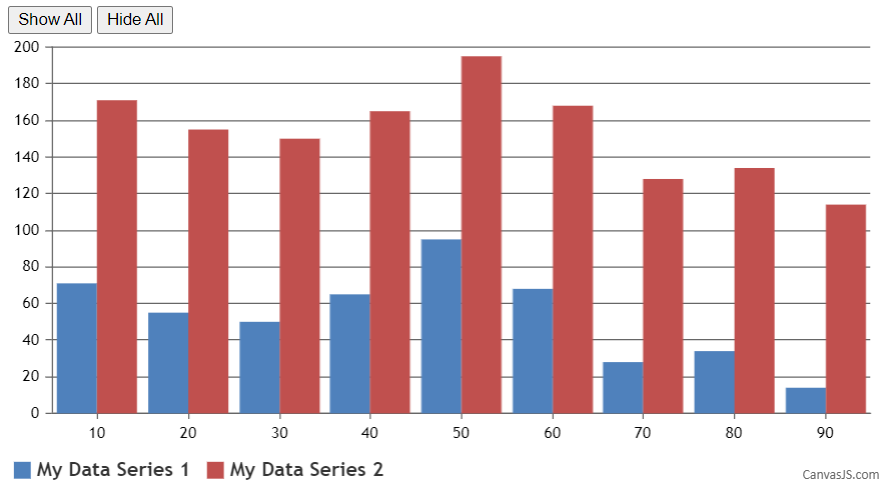
    I want to hide data points but without click legends labels.

    For example i tried like this but not working.

    var chart = new chart = new CanvasJS.Chart(...);
    
    chart.data[0].visible = false;
    chart.data[1].visible = false;
    chart.render();

    Or hide all function:

    function HideAll() {
        for (var i = 0; i < chart.data.length; i++) {
            chart.data[i].visible = false;
        }
        chart.render();
    }

    Or show all function:

    function ShowAll() {
        for (var i = 0; i < chart.data.length; i++) {
            chart.data[i].visible = true;
        }
        chart.render();
    }
    • This topic was modified 6 years, 5 months ago by sonerb.
    #21922

    @sonerb,

    You are trying to update visible property directly and not through chart-options. Updating chart options should work fine in this case. Can you kindly update your code to chart.options.data[i].visible = false; instead of chart.data[i].visible = false; and the same in ShowAll() aswell.

    If this doesn’t solve your issue, kindly create jsfiddle reproducing the issue, so that we can look in to your code, understand it better and help you out.

    Updating Chart options


    Vishwas R
    Team CanvasJS

    #21966

    @vishwas thank you for helping. It’s work for me.

    I have an another question, maybe i should open new topic but I want to ask now.
    Can I get default data color?
    I can get, if I set color properties and render. But I can’t get like this;

    var data_color = chart.options.data[0].color;

    #21967

    Here is my fiddle, maybe someone want to use.

    https://jsfiddle.net/QwZuf/1888/

    #21978

    @sonerb,

    Once the chart is rendered, you can get dataSeries color using get method as shown in the code snippet below –

    for(var i = 0; i < chart.data.length; i++) {
       console.log(chart.data[i].get("color"))
    }

    Please take a look at this jsfiddle.

    Show DataSeries Color


    Vishwas R
    Team CanvasJS

Viewing 5 posts - 1 through 5 (of 5 total)

You must be logged in to reply to this topic.