Login to Ask a Question or Reply
Home › Forums › Chart Support › send json to datapoint › Reply To: send json to datapoint
July 2, 2018 at 12:48 pm
#21351
The above code seems to be working fine (along with XAMPP), if Y values – $f_1[0] are defined. Please take a look at the sample code below.
<?php

$f_1 = array(192, 168, 100);
$f_2 = array(80, 100, 150);
$f_3 = array(120, 80, 120);
$f_4 = array(100, 200, 300);

$dataPoints = array(
array("label"=> "TPV 1", "y"=> $f_1[0]),
array("label"=> "TPV 2", "y"=> $f_2[0]),
array("label"=> "TPV 3", "y"=> $f_3[0]),
array("label"=> "TPV 4", "y"=> $f_4[0])
);

?>
<!DOCTYPE HTML>
<html>
<head>
<script>
window.onload = function () {

var chart = new CanvasJS.Chart("chartContainer", {
	animationEnabled: true,
	theme: "light2", // "light1", "light2", "dark1", "dark2"
	title:{
		text: "Datos de Ventas"
	},
	axisY: {
		title: "Cantidad"
	},
	data: [{
		type: "column",
		showInLegend: true,
		legendMarkerColor: "grey",
		legendText: "leyenda",
		dataPoints: <?php echo json_encode($dataPoints, JSON_NUMERIC_CHECK); ?>
	}]
});
chart.render();

}
chart.render();
</script>
</head>
<body>
<div id="chartContainer" style="height: 370px; width: 100%;"></div>
<script src="https://cdn.canvasjs.com/canvasjs.min.js"></script>
</body>
</html>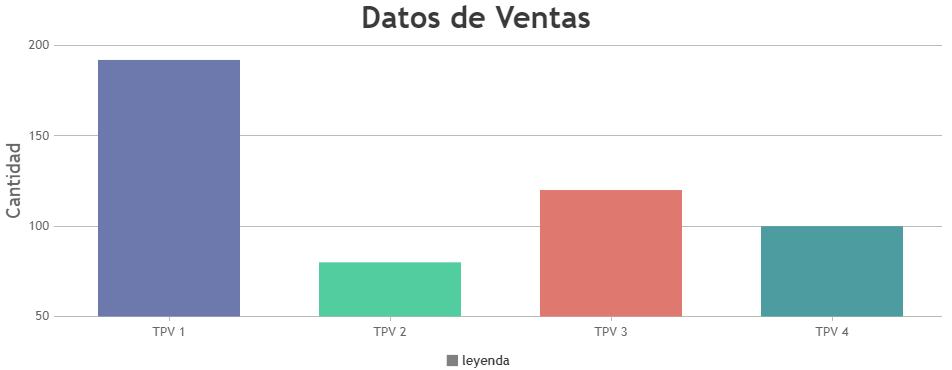
If this doesn’t solve your requirement, kindly share a sample project along with sample data over google-drive or onedrive so that we can understand your requirement better and help you out.
__
Priyanka M S
Team CanvasJS