Login to Ask a Question or Reply
You must be logged in to post your query.
Home › Forums › Chart Support › send json to datapoint
send json to datapoint
- This topic has 15 replies, 2 voices, and was last updated 7 years, 11 months ago by
tekit0.
-
July 2, 2018 at 2:15 am #21348
Hi, I’m Antonio, i’m, new to this, and I’m trying to send via json_encode, data to make a bar chart but I think it does not interpret the json well.
This is the simple array inside of php code:
***
$dataPoints = array(
array(“label”=> “TPV 1”, “y”=> $f_1[0]),
array(“label”=> “TPV 2”, “y”=> $f_2[0]),
array(“label”=> “TPV 3”, “y”=> $f_3[0]),
array(“label”=> “TPV 4”, “y”=> $f_4[0])
);***
This is the echo json_encode($dataPoints, JSON_NUMERIC_CHECK); result: [{“label”:”TPV 1″,”y”:75},{“label”:”TPV 2″,”y”:657},{“label”:”TPV 3″,”y”:119},{“label”:”TPV 4″,”y”:92}] (I think it’s right, if i put this code in the script function, work perfectly)
***
Code in head:
…
<script>
window.onload = function () {var chart = new CanvasJS.Chart(“chartContainer”, {
animationEnabled: true,
theme: “light2”, // “light1”, “light2”, “dark1”, “dark2”
title:{
text: “Datos de Ventas”
},
axisY: {
title: “Cantidad”
},
data: [{
type: “column”,
showInLegend: true,
legendMarkerColor: “grey”,
legendText: “leyenda”,
dataPoints: <?php echo json_encode($dataPoints, JSON_NUMERIC_CHECK); ?>
}]
});
chart.render();}
</script>*****
And the code of the body:
<div id=”chartContainer” style=”height: 370px; max-width: 920px; margin: 0px auto;”></div>
<script src=”js/canvasjs.min.js”></script>*******
can someone tell me why the error is caused?
if I use the json_encode it does not draw the data. Legends appear but do not interpret the dataThanks to all, and sorry for my bad english
July 2, 2018 at 2:22 am #21349I try this example : https://canvasjs.com/php-charts/chart-index-data-label/
but is similar, don’t draw the data.
I use xampp and i have enable the json
json version 1.6.0July 2, 2018 at 12:48 pm #21351The above code seems to be working fine (along with XAMPP), if Y values –
$f_1[0]are defined. Please take a look at the sample code below.<?php $f_1 = array(192, 168, 100); $f_2 = array(80, 100, 150); $f_3 = array(120, 80, 120); $f_4 = array(100, 200, 300); $dataPoints = array( array("label"=> "TPV 1", "y"=> $f_1[0]), array("label"=> "TPV 2", "y"=> $f_2[0]), array("label"=> "TPV 3", "y"=> $f_3[0]), array("label"=> "TPV 4", "y"=> $f_4[0]) ); ?> <!DOCTYPE HTML> <html> <head> <script> window.onload = function () { var chart = new CanvasJS.Chart("chartContainer", { animationEnabled: true, theme: "light2", // "light1", "light2", "dark1", "dark2" title:{ text: "Datos de Ventas" }, axisY: { title: "Cantidad" }, data: [{ type: "column", showInLegend: true, legendMarkerColor: "grey", legendText: "leyenda", dataPoints: <?php echo json_encode($dataPoints, JSON_NUMERIC_CHECK); ?> }] }); chart.render(); } chart.render(); </script> </head> <body> <div id="chartContainer" style="height: 370px; width: 100%;"></div> <script src="https://cdn.canvasjs.com/canvasjs.min.js"></script> </body> </html>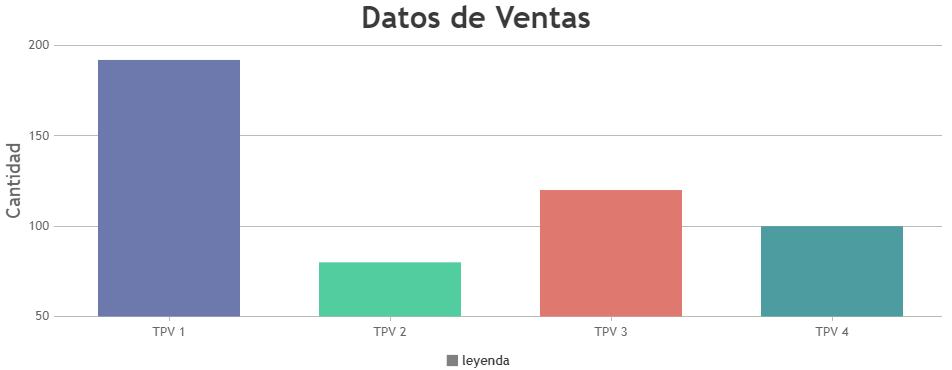
If this doesn’t solve your requirement, kindly share a sample project along with sample data over google-drive or onedrive so that we can understand your requirement better and help you out.
__
Priyanka M S
Team CanvasJSJuly 2, 2018 at 2:00 pm #21352Can the problem of how do I get the variable come?
$f_1 = mysqli_fetch_row($result_f1)
and then I echo the variable $f_1[0]
July 2, 2018 at 7:21 pm #21355Can you kindly share a sample project along with sample database over Onedrive or Google-Drive, so that we can look into your code, understand it better and help you out?
__
Priyanka M S
Team CanvasJSJuly 2, 2018 at 7:26 pm #21357ok, I try to reduce the code by removing unnecessary information
July 2, 2018 at 7:46 pm #21358July 4, 2018 at 7:24 pm #21369We are looking into it, and will get back to you at the earliest.
__
Priyanka M S
Team CanvasJSJuly 4, 2018 at 8:19 pm #21371Thank you very much for your interest in my problem
July 5, 2018 at 7:26 pm #21386Please take a look at this updated sample project.
Here are the few changes made to your project:
1. The variablesDE TAQUILLA 4was not defined with any values. Now it’s defined.
2. Make sure the dataPoints are available before the chart is rendered. The PHP code for SQL is written before the script for rendering chart.
3. Used JSON_NUMERIC_CHECK as parameter in json_encode() method in order to convert string value of dataPoint(PHP variable) to it’s corresponding numeric value.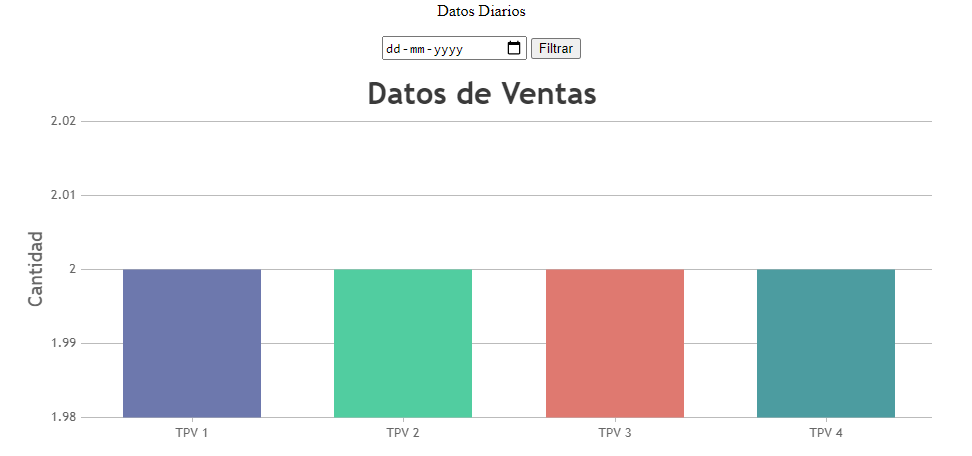
__
Priyanka M S
Team CanvasJSJuly 6, 2018 at 11:24 pm #21574Ok. I try this weekend.
ThanksJuly 7, 2018 at 4:36 pm #21579It does not work for me.
The purpose of the web is to select a date in a form, and in that same web, to show the queries that are made to the database and that canvasjs draw the graph with the sales data.I check that the data enters the array:
array in json with numeric check:
[{“label”:”TPV 1″,”y”:2},{“label”:”TPV 2″,”y”:2},{“label”:”TPV 3″,”y”:2},{“label”:”TPV 4″,”y”:482}]which I do not know why canvasjs does not draw it :(
—-
I think canvasjs has no data because it runs in head.
– first: canvas draws the graph (but no have data).
– second: I request the date in the form.
– third: I make operations with data, variables, I draw the html table …
– 4: in the end, I call the chartcontainer, but this has no information, because it has not returned to the head.July 10, 2018 at 6:07 pm #21749@tekit0,
The sample project that we have provided is working fine at our end. Please try to follow the above-mentioned instructions and it should work fine for you.in the end, I call the chartcontainer, but this has no information, because it has not returned to the head.
Please make sure that the dataPoints are defined before rendering the chart.
__
Priyanka M S
Team CanvasJSJuly 10, 2018 at 6:34 pm #21750I try again…
July 11, 2018 at 2:58 am #21756Now work really fine! thank u so much Priyanka !!!!!!
my problem was that the date selector kept appearing, but in the end what I did is that I send the date from the form with get and I show all the data in a second web.
You must be logged in to reply to this topic.