Login to Ask a Question or Reply
You must be logged in to post your query.
Home › Forums › Chart Support › Creating Dynamic Graphs on a PHP page based off MySQL data
Creating Dynamic Graphs on a PHP page based off MySQL data
- This topic has 5 replies, 2 voices, and was last updated 8 years, 4 months ago by
Indranil.
-
March 6, 2018 at 10:15 pm #19847
Hi,
I looked at “How can I use PHP MySQL Dynamic data” Forum and attempted to get my graph to work but am having trouble even displaying a dynamic graph with data. Eventually I want to be able to sum my count value and have the dynamic graph tick every second with the new query sum(count) value. Before I get there, I was hoping to just get a dynamic graph to work with my MySQL table. Here is my PHP code:
<?phpheader(‘Content-Type: application/json’);
$con = mysqli_connect(“18.85.28.15″,”lindsay”,”McGelin123!”,”python”);
// Check connection
if (mysqli_connect_errno($con))
{
echo “Failed to connect to DataBase: ” . mysqli_connect_error();
}else
{
$data_points = array();$result = mysqli_query($con, “SELECT count, timestamp FROM skelCount”);
while($row = mysqli_fetch_array($result))
{
$point = array(“label” => $row[‘timestamp’] , “y” => $row[‘count’]);array_push($data_points, $point);
}echo json_encode($data_points, JSON_NUMERIC_CHECK);
}
mysqli_close($con);?>
And here is my HTML code:
<!DOCTYPE html>
<head>
<!– javascript –>
<script type=”text/javascript” src=”js/jquery.canvasjs.min.js”></script>
<script type=”text/javascript” src=”js/canvasjs.min.js”></script><script type=”text/javascript”>
$(document).ready(function () {$.getJSON(“canvas-json-return.php”, function (result) {
var chart = new CanvasJS.Chart(“chartContainer”, {
data: [
{
dataPoints: result
}
]
});chart.render();
});
});
</script>
</head>
<body><div id=”chartContainer” style=”width: 800px; height: 380px;”></div>
</body>
</html>
March 7, 2018 at 9:50 am #19849Please download the PHP sample from the download page which includes example for creating chart from database. In case it doesn’t help your out can you please create a sample project with a sample database and share it over Google-Drive or Onedrive so that we can understand your code better and help you out?
___________
Indranil Deo,
Team CanvasJSMarch 8, 2018 at 10:32 pm #19867https://docs.google.com/document/d/1Nk1DGdnv2jZX8J3Sf2BPLjIqVzF17KqA0gRSdJ3FfjI/edit?usp=sharing
Here is the shareable link to my project. Thanks!
March 9, 2018 at 9:40 am #19872I think you forgot to share the link to the sample project. The link shared is for the ReadMe file. Can you kindly share the link to the sample project, so that we can look into it and help you out!
___________
Indranil Deo,
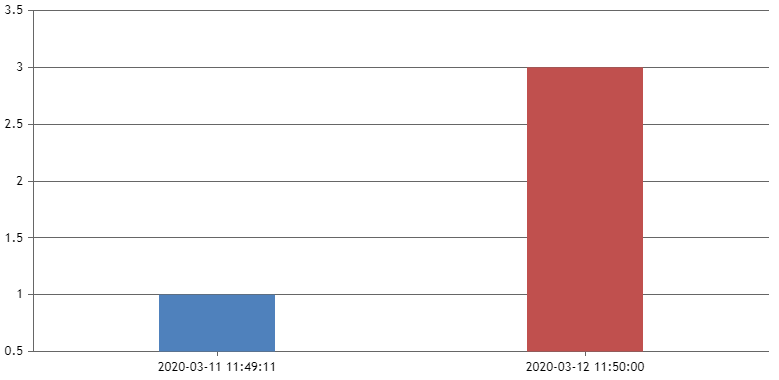
Team CanvasJSMarch 9, 2018 at 8:31 pm #19879March 12, 2018 at 11:45 am #19892Based on the sample project shared by you the SQL query used seems to have some issues. Comparing timestamp properly should work fine in your case, i.e.
SELECT timestamp, count FROM skelCount WHERE timestamp >= TIMESTAMP(DATE_SUB(NOW(), INTERVAL 1 day))should work fine in this scenario. Please take a look at this StackOverflow link for more information on fetching data n days ago.Also, kindly take a look at the updated project. Below is the screenshot of the chart when its run in local-server.
___________
Indranil Deo
Team CanvasJS
You must be logged in to reply to this topic.