@vishnumohan89,
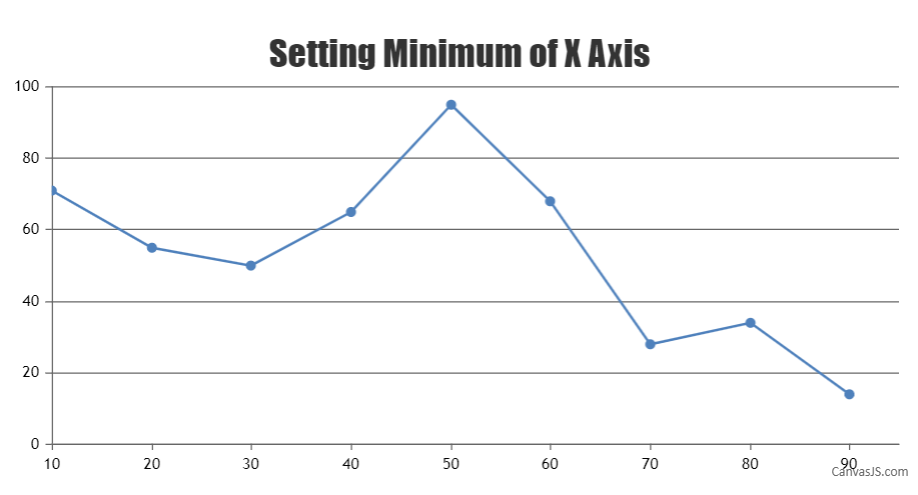
To design a line chart that always starts from y-axis line you can set the minimum of axisX to the x-value of the first dataPoint. Please check the below code snippet –
function setAxisXMinimum(){
   chart.axisX[0].set("minimum", chart.options.data[0].dataPoints[0].x);
}
Also, kindly take a look at this JSFiddle for complete working code.
___________
Indranil Deo
Team CanvasJS