Hi Cristi,
1) This is mostly about both index labels and axis labels. Is there a switch anywhere?
By default the indexLabel is not shown, In case you would like to show the indexLabel, you can use indexLabel property to show some content (Eg: x-value or y-value)
To hide the axis labels you can use properties like labelFontSize or labelformatter. I would recommend you to use labelFormatter for your requirement.
2) Same question for all pie labels, what if we don’t want any of them?
In Pie chart, only if you provide label property in the dataPoint, the indexLabels will be shown. By default the indexLabels are not shown.
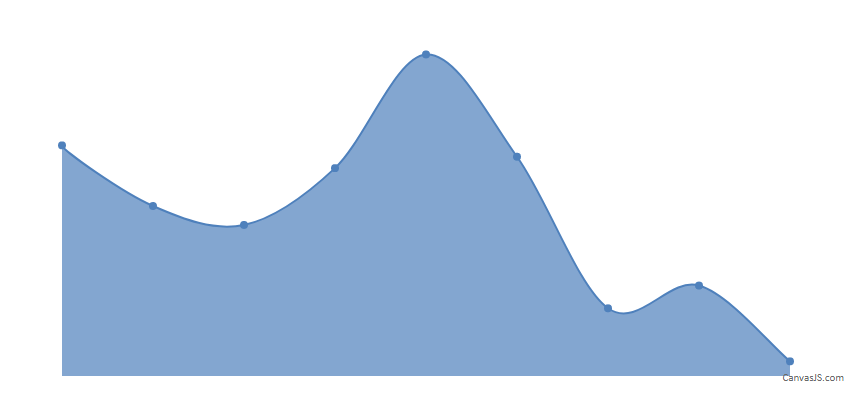
3) As a more broader issue, is there a simple switch somewhere to hide both axes, with all their labels and grid lines?
You can use the properties like gridThickness(to hide the grid lines), tickLength(to hide the axis ticks), lineThickness(to hide the axis line) and labelFormatter(to hide the labels) for both X and Y axis
in order to hide the axes completely. Please take a look at the code snippet below,
 axisX:{
    gridThickness: 0,
    tickLength: 0,
    lineThickness: 0,
    labelFormatter: function(){
      return " ";
    }
  },
  axisY:{
    gridThickness: 0,
    tickLength: 0,
    lineThickness: 0,
    labelFormatter: function(){
      return " ";
    }
  },
Please take a look at this JSFiddle for an example with complete code on charts with hidden axes.
.