Login to Ask a Question or Reply
You must be logged in to post your query.
Home › Forums › Chart Support › Collection data with Ajax
Collection data with Ajax
- This topic has 8 replies, 4 voices, and was last updated 9 years, 11 months ago by
Vishwas R.
-
April 30, 2016 at 8:55 am #10378
please help me collection live data with Ajax from Json.
It like:
$(document).ready(function () {
$.ajax({
type: ‘GET’,
url: ‘http://example/functions.php’,
data: { get_param: ‘value’ },
success: function (data) {
var names = data
$(‘#cand’).html(data);
}
});
});I take it from: http://stackoverflow.com/questions/8951810/how-to-parse-json-data-with-jquery-javascript
Help me to collection Json to render graph
Thanks!!!May 5, 2016 at 12:25 pm #10390Michael,
You can parse the JSON data and pass dataPoints to respective dataSeries in chart options as shown below
$.ajax({
  type: 'GET',
  url: 'https://api.npoint.io/191c62a905159a49256e',
  dataType: 'json',
  success: function(field) {
    for (var i = 0; i < field.length; i++) {
      dataPointsA.push({
        x: field[i].time,
        y: field[i].xxx
      });
      dataPointsB.push({
        x: field[i].time,
        y: field[i].yyy
      });
    }

    var chart = new CanvasJS.Chart("chartContainer", {
      title: {
        text: "JSON from External File"
      },
      exportEnabled: true,
      data: [{
        type: "line",
        name: "line1",
        xValueType: "dateTime",
        dataPoints: dataPointsA
      }, {
        type: "line",
        name: "line2",
        xValueType: "dateTime",
        dataPoints: dataPointsB
      }, ]
    });

    chart.render();

  }
});
Here is an example for loading JSON data from external source using AJAX.
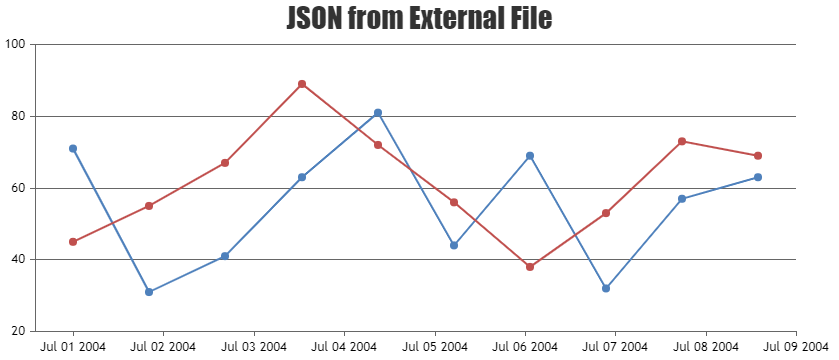
You can also refer loading data from external JSON in this example.
—-
Vishwas R
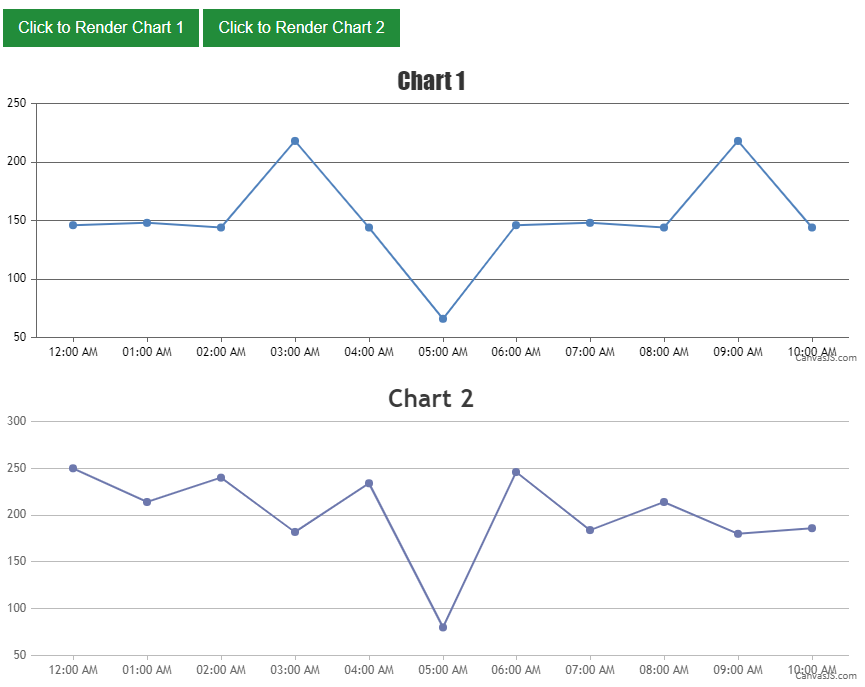
Team CanvasJSMay 30, 2016 at 11:53 am #10584This is my implementation, using AJAX requests. Unfortunately, i’m unable to find out why it is not working, Kindly help finding where I have gone wrong.
May 30, 2016 at 1:57 pm #10587Generally JavaScript code will function in the head before code in the body. The head section is usually used to contain information about the page that you don’t necessarily see like the meta keywords meta description or title of a page.
Here in your case, Buttons with id ‘chart1’ and ‘chart2’ are created after script is run, but where it fails to fetch buttons with those ids. You can move script tag to body so that it works fine. Here is your working code.
Refer these links for more info on placement of JavaScript code.
TutorialPoints
W3Schools
Stackoverflow—-
Vishwas R
Team CanvasJS-
This reply was modified 10 years ago by
June 1, 2016 at 3:18 pm #10903Hi,
Thank you for the help.
It doesn’t seem to work after including the processdata function. It throws a “Chart not defined error”.
This is the codeJune 1, 2016 at 7:00 pm #11040June 3, 2016 at 2:32 pm #11280Thank you so much! Passing the “chart” as parameter solved it!
June 20, 2016 at 2:39 pm #11408Hi, Im creating a chart from a collection data with ajax using example like you (@Vishwas R) mentioned above. My code seems to be working in jsfiddle in this my chart but it doesn’t seem to be working when I use the same code in a text editor(in my case Sublime Text)
-
This reply was modified 9 years, 11 months ago by
saimeera.jp.
-
This reply was modified 9 years, 11 months ago by
June 20, 2016 at 6:24 pm #11413 -
This reply was modified 10 years ago by
You must be logged in to reply to this topic.