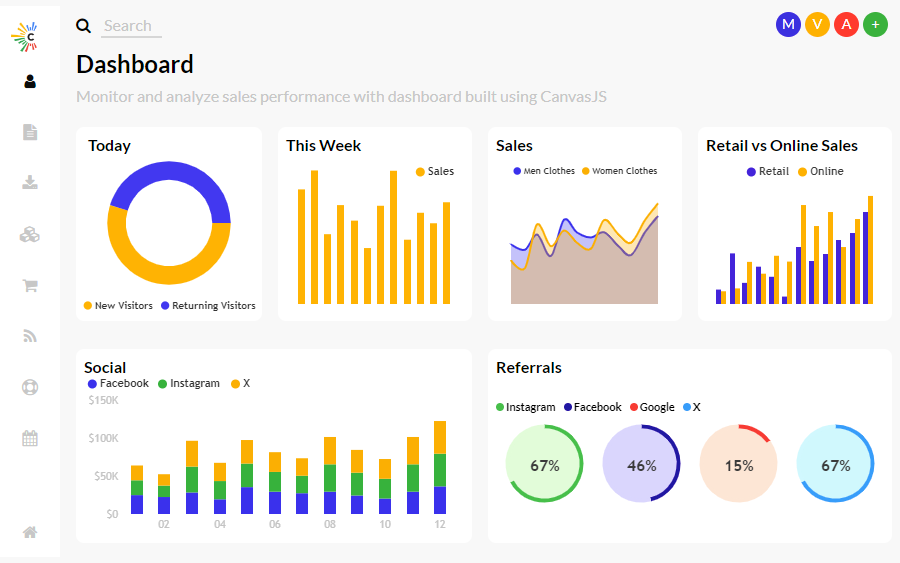
Beautiful JavaScript Charting Library
HTML5 JavaScript Charting Library with a Simple API and 10x Performance – makes your dashboards fly!
- Simple JavaScript Charting API
- 10X Performance
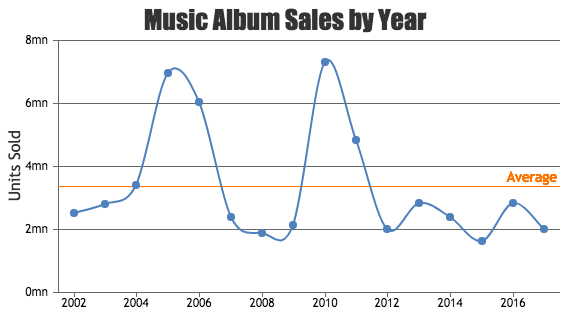
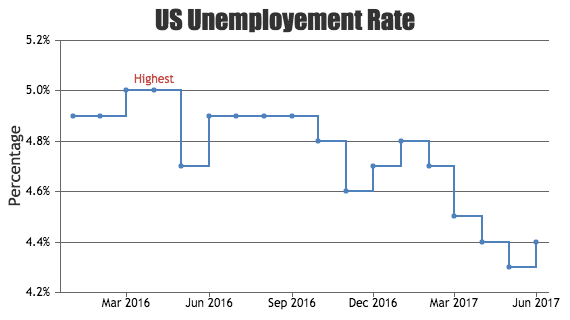
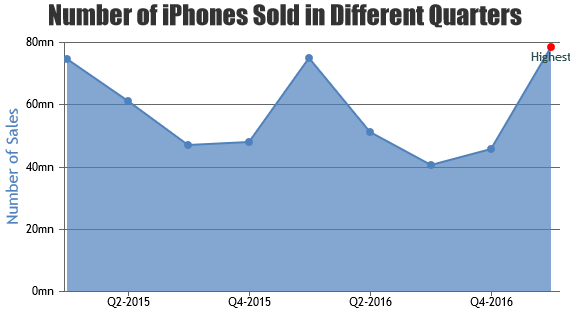
- 30+ Chart Types
- Well Documented
- Supports Chrome, Edge, Firefox, Safari, IE8+
- Support Directly from Developers