Hi Sunil,
I am trying to figure out how to create a line graph using 2 sets of data which are stored in a json object.
Below is the code for a single line graph:
Demo
$( document ).ready(function() {
var dps = [ {x: 1, y: 10}, {x: 2, y: 20}, {x: 3, y: 30} ]; //dataPoints.
var chart = new CanvasJS.Chart(“chartContainer”,{
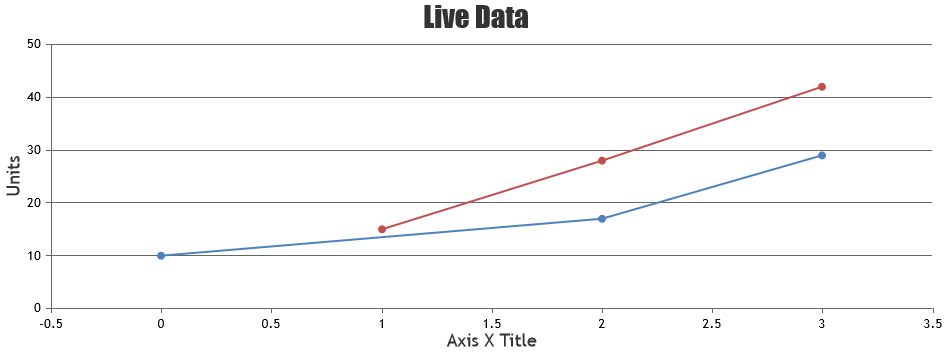
title :{
text: “Live Data”
},
axisX: {
title: “Axis X Title”
},
axisY: {
title: “Units”
},
data: [{
type: “line”,
dataPoints : dps
}]
});
chart.render();
});
What I would like to do is modify dps so that 2 lines are graphed, meaning the dps variable looks something like:
var dps = [ [{x: 1, y: 10}, {x: 2, y: 20}, {x: 3, y: 30}] , [{x: 1, y: 30}, {x: 2, y: 50}, {x: 3, y: 70}] ];
How do you build such a json object by merely modifying the above variable dps from above?
Thanks,
Jim
.