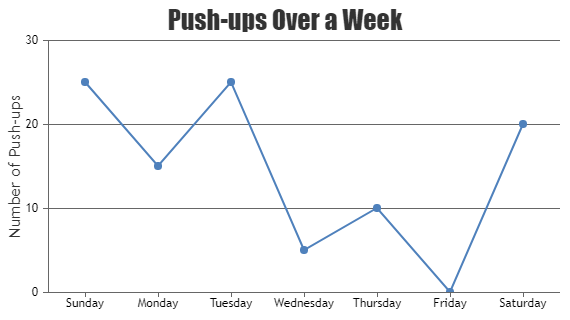
Line / Trend Charts are drawn by interconnecting all data points in a series using straight line segments. The given example shows simple PHP Line Chart. It also includes source code that you can try running locally.
Copy and paste this URL into your WordPress site to embed