jQuery Stacked Bar Charts & Graphs | CanvasJS
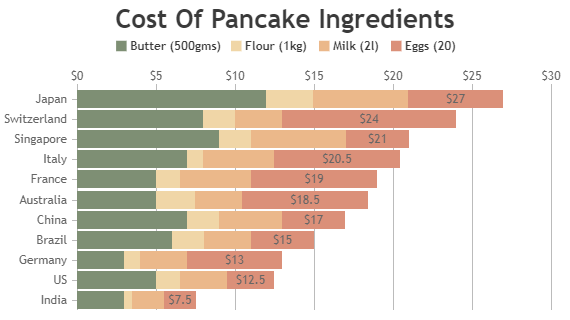
jQuery Stacked Bar Chart is formed by stacking multiple data-series, one on top of the other and is useful to compare contribution of two or more series with the total. Given example shows simple jQuery Stacked Bar Chart along with HTML source code that you can edit in-browser or save to run it locally.