JavaScript Charts & Graphs with Draggable Data Points | CanvasJS
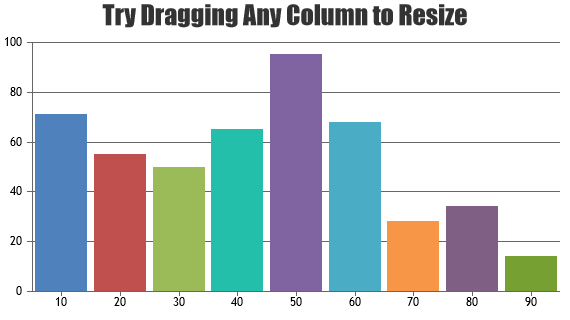
JavaScript Chart with draggable data points that you can manipulate using mouse to update it's value. This feature can be useful in building applications that allow users to change values directly to see its effects on other parameters. The Library provides several methods to get and set values for different properties. The given example uses ... Continue reading JavaScript Charts & Graphs with Draggable Data Points | CanvasJS