JavaScript Charts & Graphs with Images on Top | CanvasJS
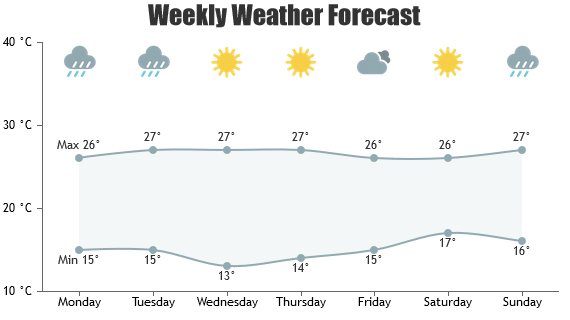
In many cases, overlaying images on top of charts enhances the readability. You can overlay images on chart and position them as required by using Methods provided by CanvasJS API. Given example shows weather forecast using JavaScript Range Spline Area Chart with Image Overlay. It also includes source code that you can edit in-browser ... Continue reading JavaScript Charts & Graphs with Images on Top | CanvasJS