JavaScript Pie Charts & Graphs | CanvasJS
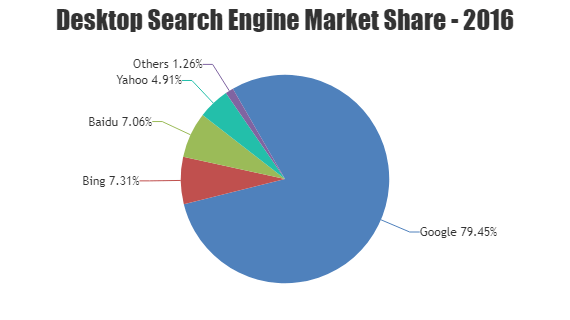
JavaScript Pie Chart divides a circle into multiple slices that are proportional to their contribution towards the total sum. Pie charts are useful in comparing the share or proportion of various items. Pie Charts are interactive, responsive, supports animation, exporting as image & can easily be integrated with popular JavaScript frameworks. Given example shows JavaScript ... Continue reading JavaScript Pie Charts & Graphs | CanvasJS
0 Comments