ASP.NET MVC Line Charts & Graphs | CanvasJS
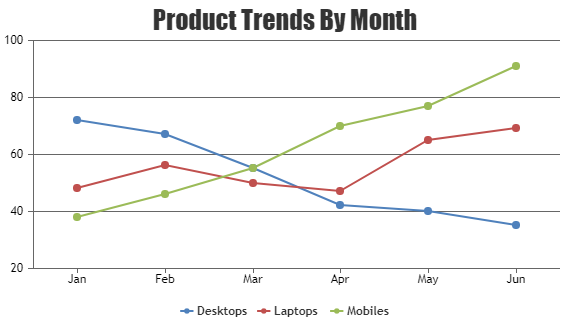
Line / Trend Charts are drawn by interconnecting all data points in a series using straight line segments. Library also allows you to plot lines as solid, dashed or dotted. Given example shows ASP.NET MVC Multi-Series Line Chart along with source code that you can try running locally.