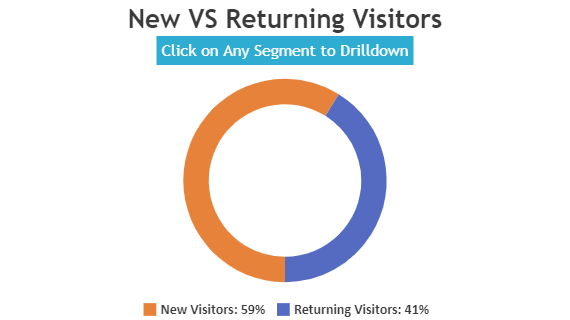
Drilldown Charts are used for better visualization of data to reveal additional details. The given example shows Doughnut chart with Drilldown functionality. It also includes source code that you can try running locally.
Copy and paste this URL into your WordPress site to embed